VScode+Qemu调试TF-M
There is an easy way to debug TF-M when using VScode, not DS5. It can be implemented in Ubuntu/MacOS(M silicon) environments.
Download
Some key dependencies:
# install mac gnuarm: click the package to install
wget https://developer.arm.com/-/media/Files/downloads/gnu-rm/10.3-2021.10/gcc-arm-none-eabi-10.3-2021.10-mac.pkg?rev=b382d51ec8d34c3fa421cf57ce97f146&hash=E3B897C8DA0E3E56C151F397C004104F00AE2EB8
# export PATH='/Applications/ARM/bin':${PATH}

# install qemu
brew install qemu # MacOS
sudo apt-get install qemu-system # Ubuntu
Build and run qemu
Set commands in .zshrc:
WORK_PATH=<your own tfm opath>
CMAKE_BUILD_PATH="$WORK_PATH/cmake_build"

alias run-qemu-an521="qemu-system-arm -cpu cortex-m33 \
                        -machine mps2-an521 \
                        -nographic -m 16 -vga none -net none \
                        -chardev stdio,id=con,mux=on \
                        -serial chardev:con \
                        -mon chardev=con,mode=readline \
                        -icount shift=6,align=off,sleep=off \
                        -rtc clock=vm -chardev pty,id=hostS0 \
                        -serial chardev:hostS0 \
                        -kernel $CMAKE_BUILD_PATH/bin/bl2.elf \
                        -device loader,file=$CMAKE_BUILD_PATH/bin/tfm_s_ns_signed.bin,addr=0x10080000"

alias debug-qemu-an521="qemu-system-arm -cpu cortex-m33 \
                        -machine mps2-an521 \
                        -nographic -m 16 -vga none -net none \
                        -chardev stdio,id=con,mux=on \
                        -serial chardev:con \
                        -mon chardev=con,mode=readline \
                        -icount shift=6,align=off,sleep=off \
                        -rtc clock=vm -chardev pty,id=hostS0 \
                        -serial chardev:hostS0 \
                        -kernel $CMAKE_BUILD_PATH/bin/bl2.elf \
                        -device loader,file=$CMAKE_BUILD_PATH/bin/tfm_s_ns_signed.bin,addr=0x10080000 \
                        -s -S" # -s, tcp gdbsever, localhost:1234; -S, listen the gdb
Note: CMAKE_BUILD_TYPE shall be Debug.
Run run-qemu-an521 to get the build log.
Debug
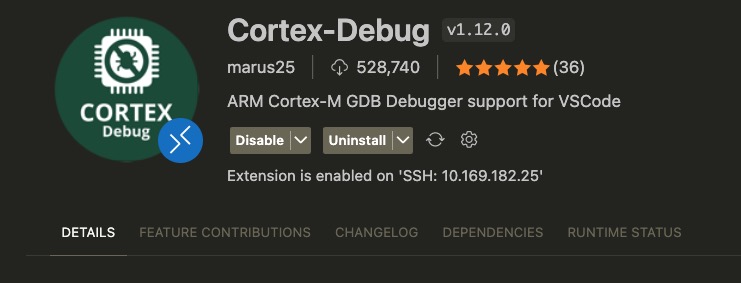
- Install the extension Cortex Debug in VScode.
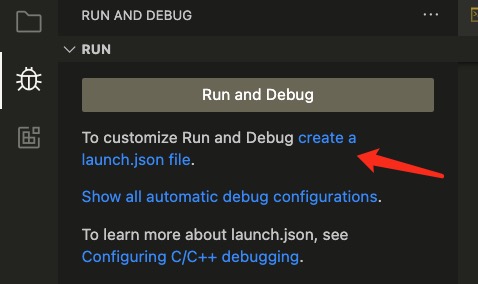
- Set launch.json file, in the left debug extension, you can see ‘create a new launch.json file’, then choose ‘Cortex Debug’. Copy the below JSON configs to override it.
{
    "version": "0.2.0",
    "configurations": [
        {
            "name": "Cortex Debug",
            "request": "launch",
            "type": "cortex-debug",
            "runToEntryPoint": "main",
            "cwd": "${workspaceFolder}",
            "servertype": "external",                                      // Debug from server, loaclhost 1234
            "gdbPath": "/Applications/ARM/bin/arm-none-eabi-gdb",          // Path of gdb
            "gdbTarget": "localhost:1234",
            "showDevDebugOutput": "raw",
            "symbolFiles": [
                {
                    "file": "${workspaceFolder}/cmake_build/bin/tfm_ns.elf",
                },
            ]
        }
    ]
}
Run debug-qemu-an521 to start the kernel.
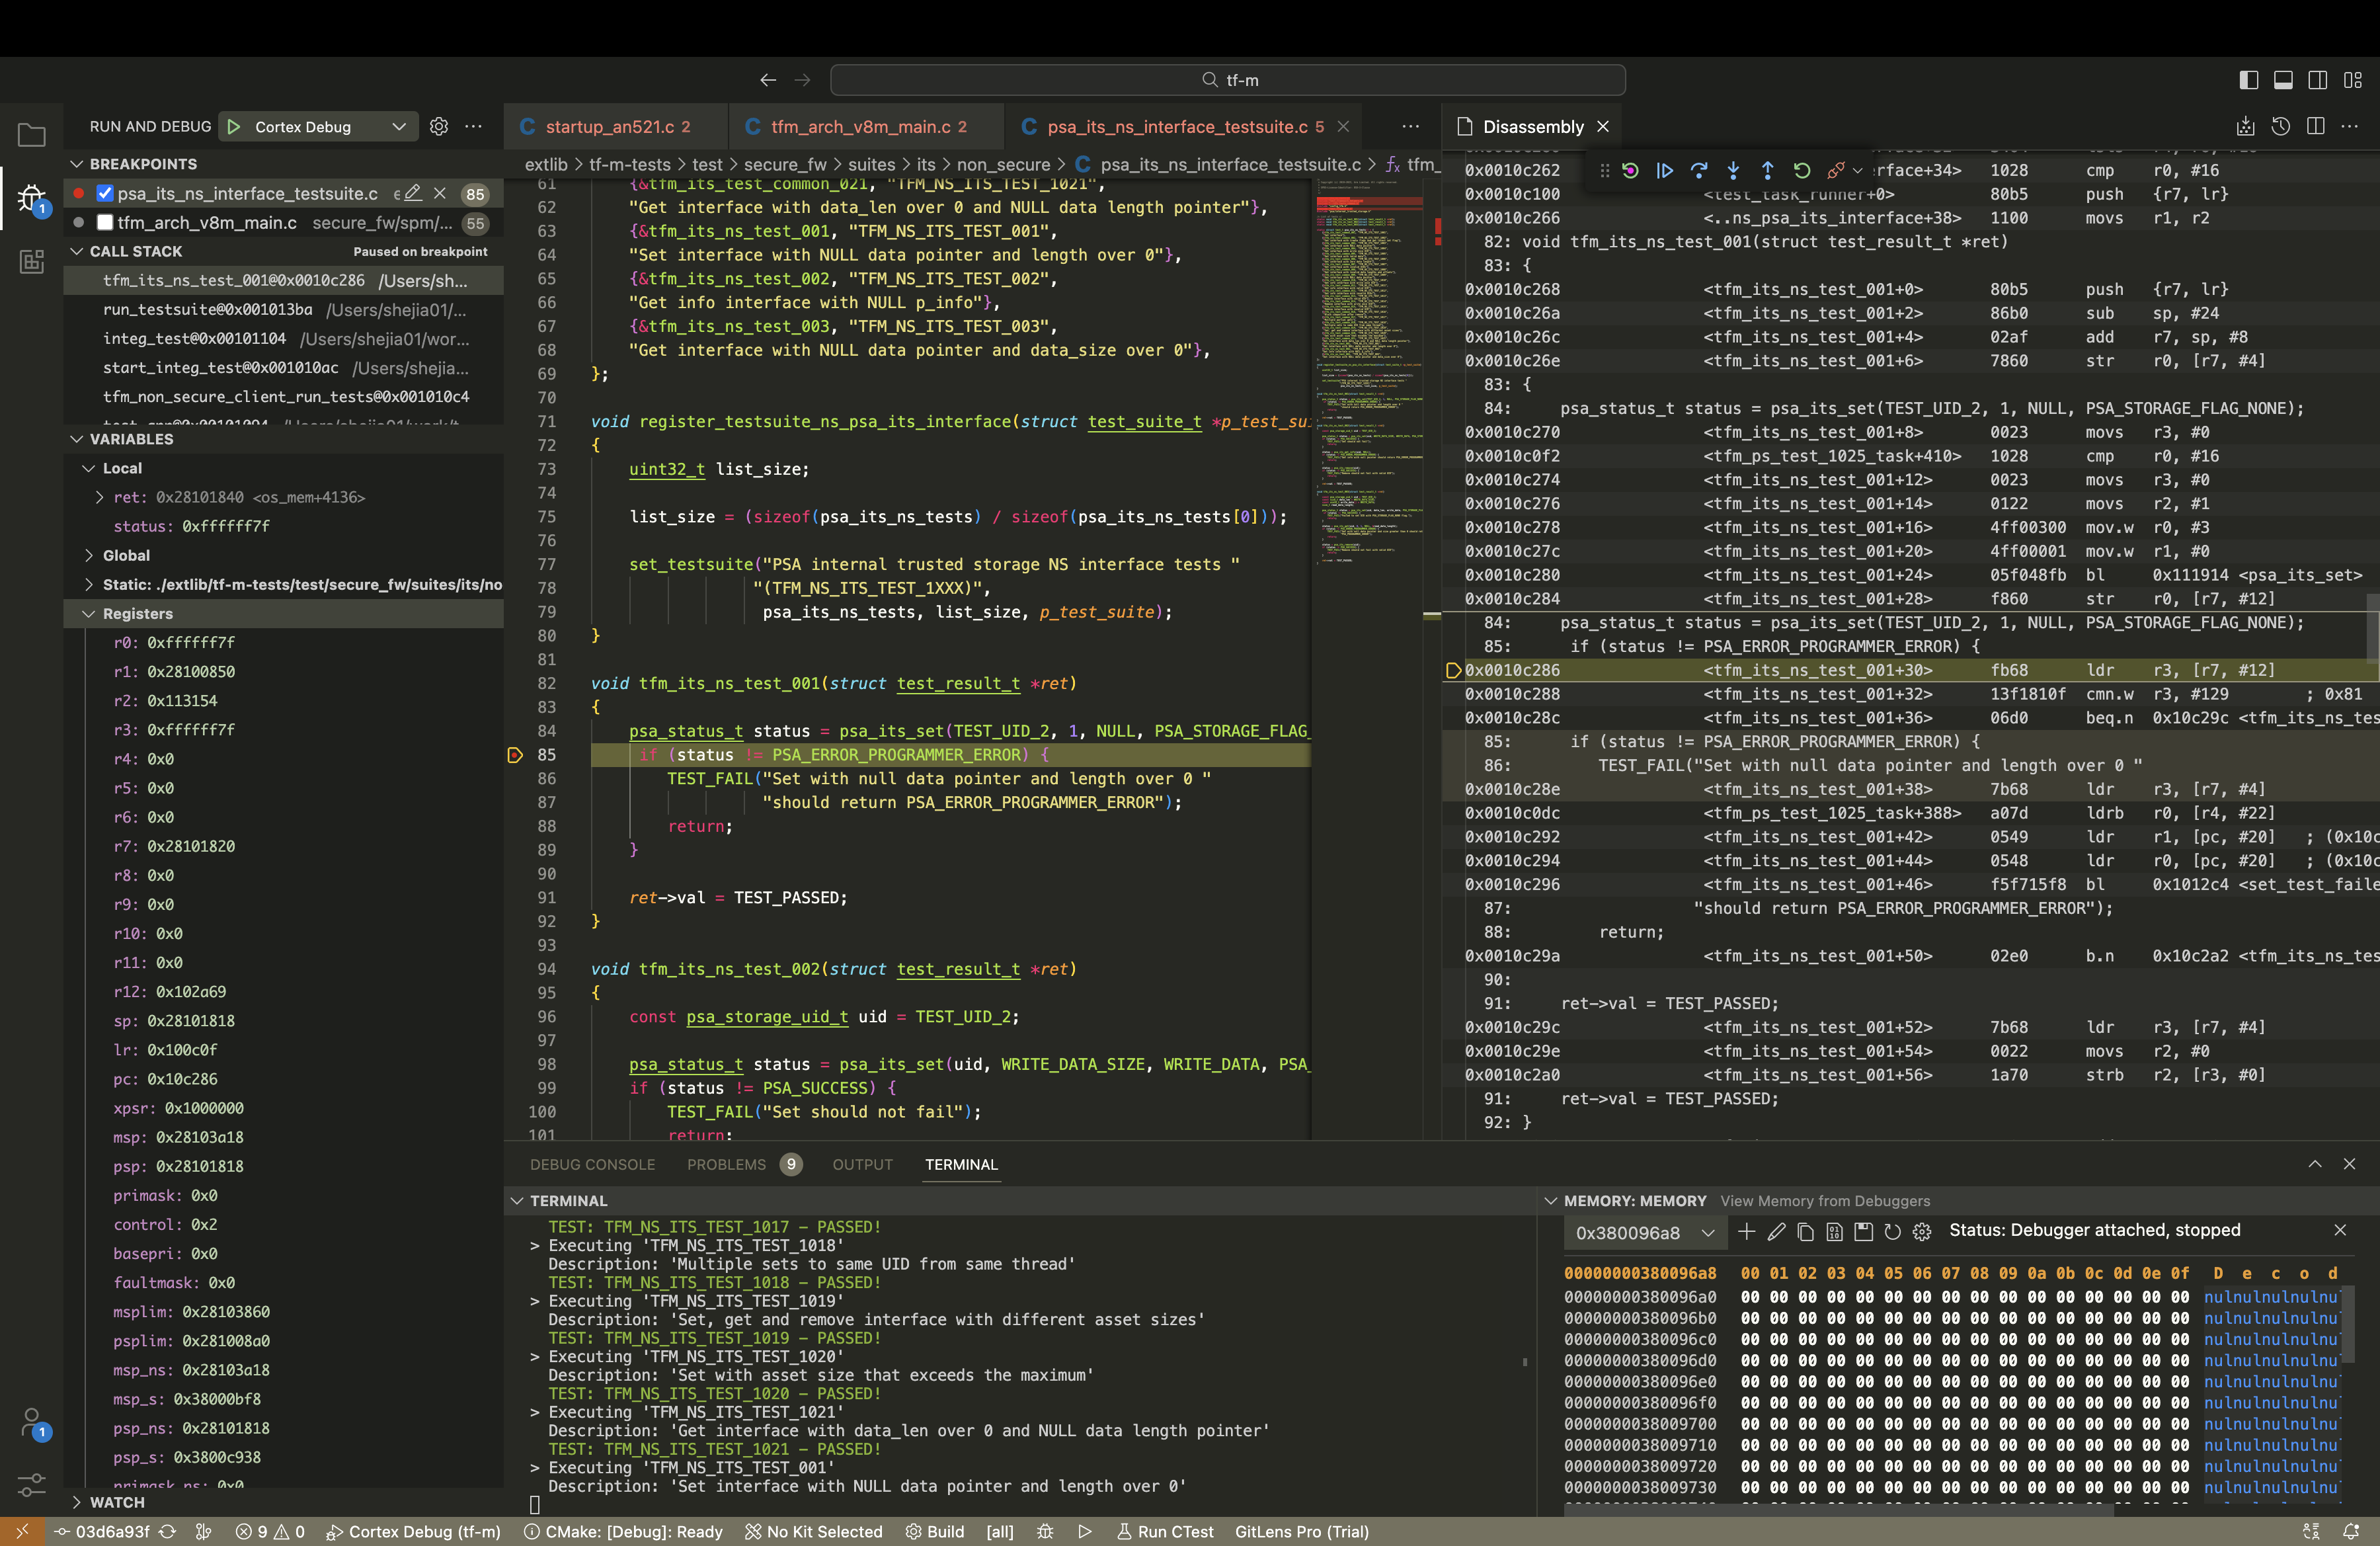
Start debugging. Click the start button in debug extension.
- Set the breakpoint to the left of the code line, anywhere of any file in the editor.
- Click continue to run to the breakpoint.
- Right-click the code and find Open Disassembly View. Then you can see the asm code and PC. You can also set a breakpoint in asm file.
- Open the terminal and switch to the Memory window to see the RAM.
- The local, global variables and registers are shown in VARIABLES in debug extensions. Click 0x to show hex format data.
- CALL STACK shows the calling routine of functions.